GTL
GTL(Graph Template Language)
proc template无法更新
ods path(prepend) work.templat(update);GTL控制分组属性
通过discreteattrmap预定义分组属性
   discreteattrmap name="backcolor";
      value "1"/ fillattrs=(color=gray ) markerattrs=(color=gray symbol=circlefilled)  lineattrs=(color=gray);
      value "2"/ fillattrs=(color=blue ) markerattrs=(color=blue symbol=circlefilled)  lineattrs=(color=blue);
   enddiscreteattrmap;
   discreteattrvar attrvar=backgroup var=grp attrmap="backcolor";
并在后续代码中调用该属性,如group=backgroup选项:
scatterplot x=xp1 y=aval / name='scatter' markerattrs=( size=3 ) group=backgroup;通过proc template修改style重定义属性
使用discreteattrmap无法分组实现带有画线的属性,如下图:
使用proc template修改style,可以设置多个GraphData1-GraphDataN为多个分组设置不同属性,其中的fillpattern可以设置柱状图中的划线。另外GTL默认输出的图形的坐标轴往往是灰色的线条,而sgplot中默认的是黑色实线,可设置 contrastcolor=black改成黑色实线。
proc template;
 define style tlout;
 parent=styles.htmlblue;
  style graphwalls from graphwalls /
   frameborder=on
   linestyle=1
   linethickness=1px
   backgroundcolor=GraphColors("gwalls")
   contrastcolor= white;

 style graphaxislines from graphaxislines /
   linestyle=1
   linethickness=1px
   contrastcolor=black;

    replace GraphFonts
         "Fonts used in graph styles" /
         'NodeDetailFont' = ("Arial",7pt,bold)
         'NodeLinkLabelFont' = ("Arial",9pt,bold)
         'NodeInputLabelFont' = ("Arial",9pt,bold)
         'NodeLabelFont' = ("Arial",9pt,bold)
         'NodeTitleFont' = ("Arial",9pt,bold)
         'GraphDataFont' = ("Arial",7pt,bold)
         'GraphUnicodeFont' = ("Arial",9pt,bold)
         'GraphValueFont' = ("Arial",9pt,bold)
         'GraphLabel2Font' = ("Arial",10pt,bold)
         'GraphLabelFont' = ("Arial",10pt,bold)
         'GraphFootnoteFont' = ("Arial",10pt,bold)
         'GraphTitleFont' = ("Arial",11pt,bold)
         'GraphTitle1Font' = ("Arial",14pt,bold)
         'GraphAnnoFont' = ("Arial",10pt,bold);

   replace GraphData1 /
         fillpattern = "R1"
         color = grey
         contrastcolor = grey
         ;
   replace GraphData2 /
         fillpattern = "NA"
         color = grey
         contrastcolor = grey
         ;
   replace GraphData3 /
         fillpattern = "R1"
         color = blue
         contrastcolor = blue
         ;
   replace GraphData4 /
         fillpattern = "NA"
         color = blue
         contrastcolor = blue
         ;
   replace GraphData5 /
         fillpattern = "R1"
         color = red
         contrastcolor = red
         ;
   replace GraphData6 /
         fillpattern = "NA"
         color = red
         contrastcolor = red
         ;
   end;
run;
GTL控制X,Y轴属性
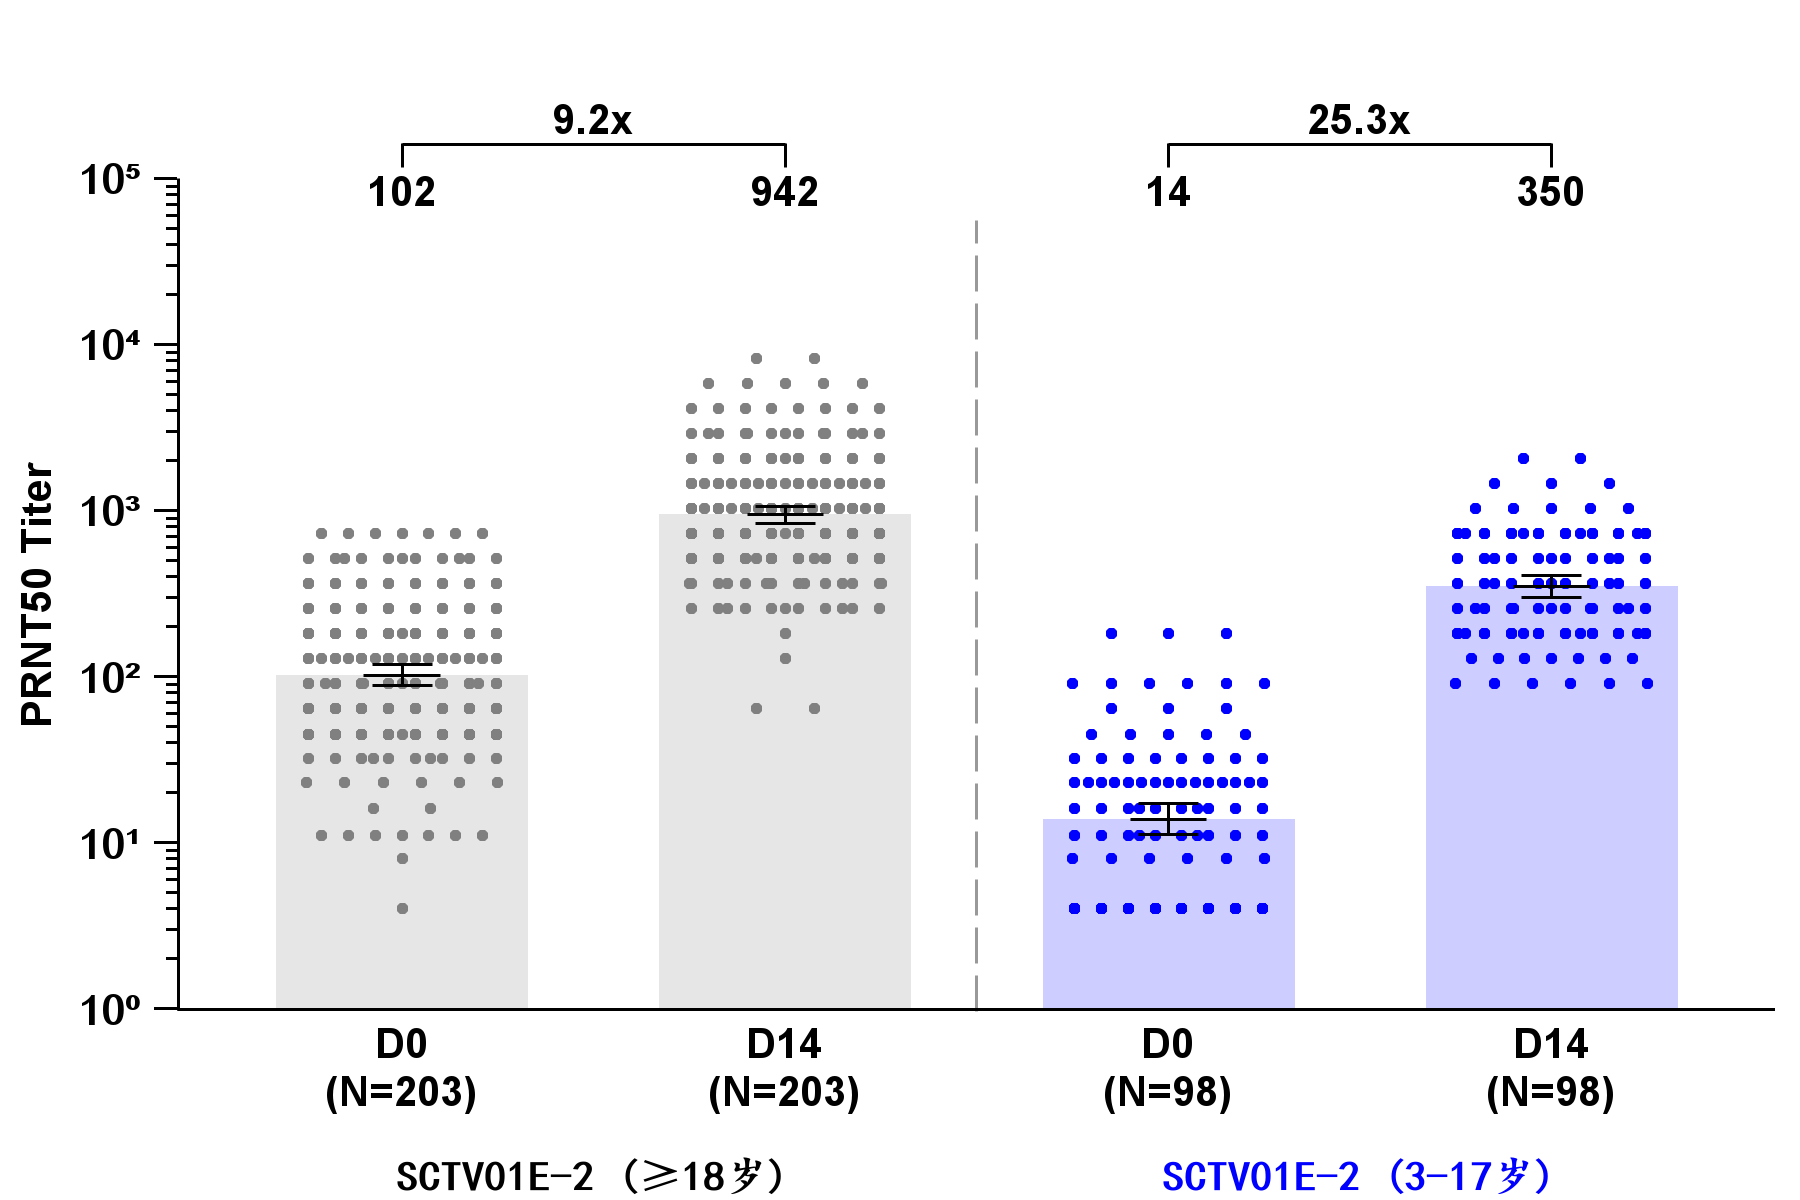
Y轴实现101, 102 ,103 …
首先定义这一类数字在10的右肩上的format
proc format;
  value yfmt
  1="10(*ESC*){Unicode '2070'x}"
    10="10(*ESC*){Unicode '00B9'x}"
    100="10(*ESC*){Unicode '00B2'x}"
    1000="10(*ESC*){Unicode '00B3'x}"
    10000="10(*ESC*){Unicode '2074'x}"
    100000="10(*ESC*){Unicode '2075'x}"
    ;
run;
并在yaxisopts语句中定义刻度值的属性字体为Arial Unicode MS,最终呈现结果如GTL控制分组属性中的图所示。
yaxisopts=(offsetmax=0 offsetmin=0 display=( LINE ticks tickvalues)  type=log
                logopts=( viewmin=1 viewmax= 10000 base=10 tickintervalstyle=logexpand minorticks=true tickvalueformat=yfmt.)
                labelattrs=( size=9 color = black weight=bold) tickvalueattrs=(size=10pt weight=bold family='Arial Unicode MS'));
GTL绘制折线图
seriesplot plot绘制折线图,groupdisplay=cluster可以控制折线在访视点左右散开,以及设置clusterwidth控制左右散开的程度。
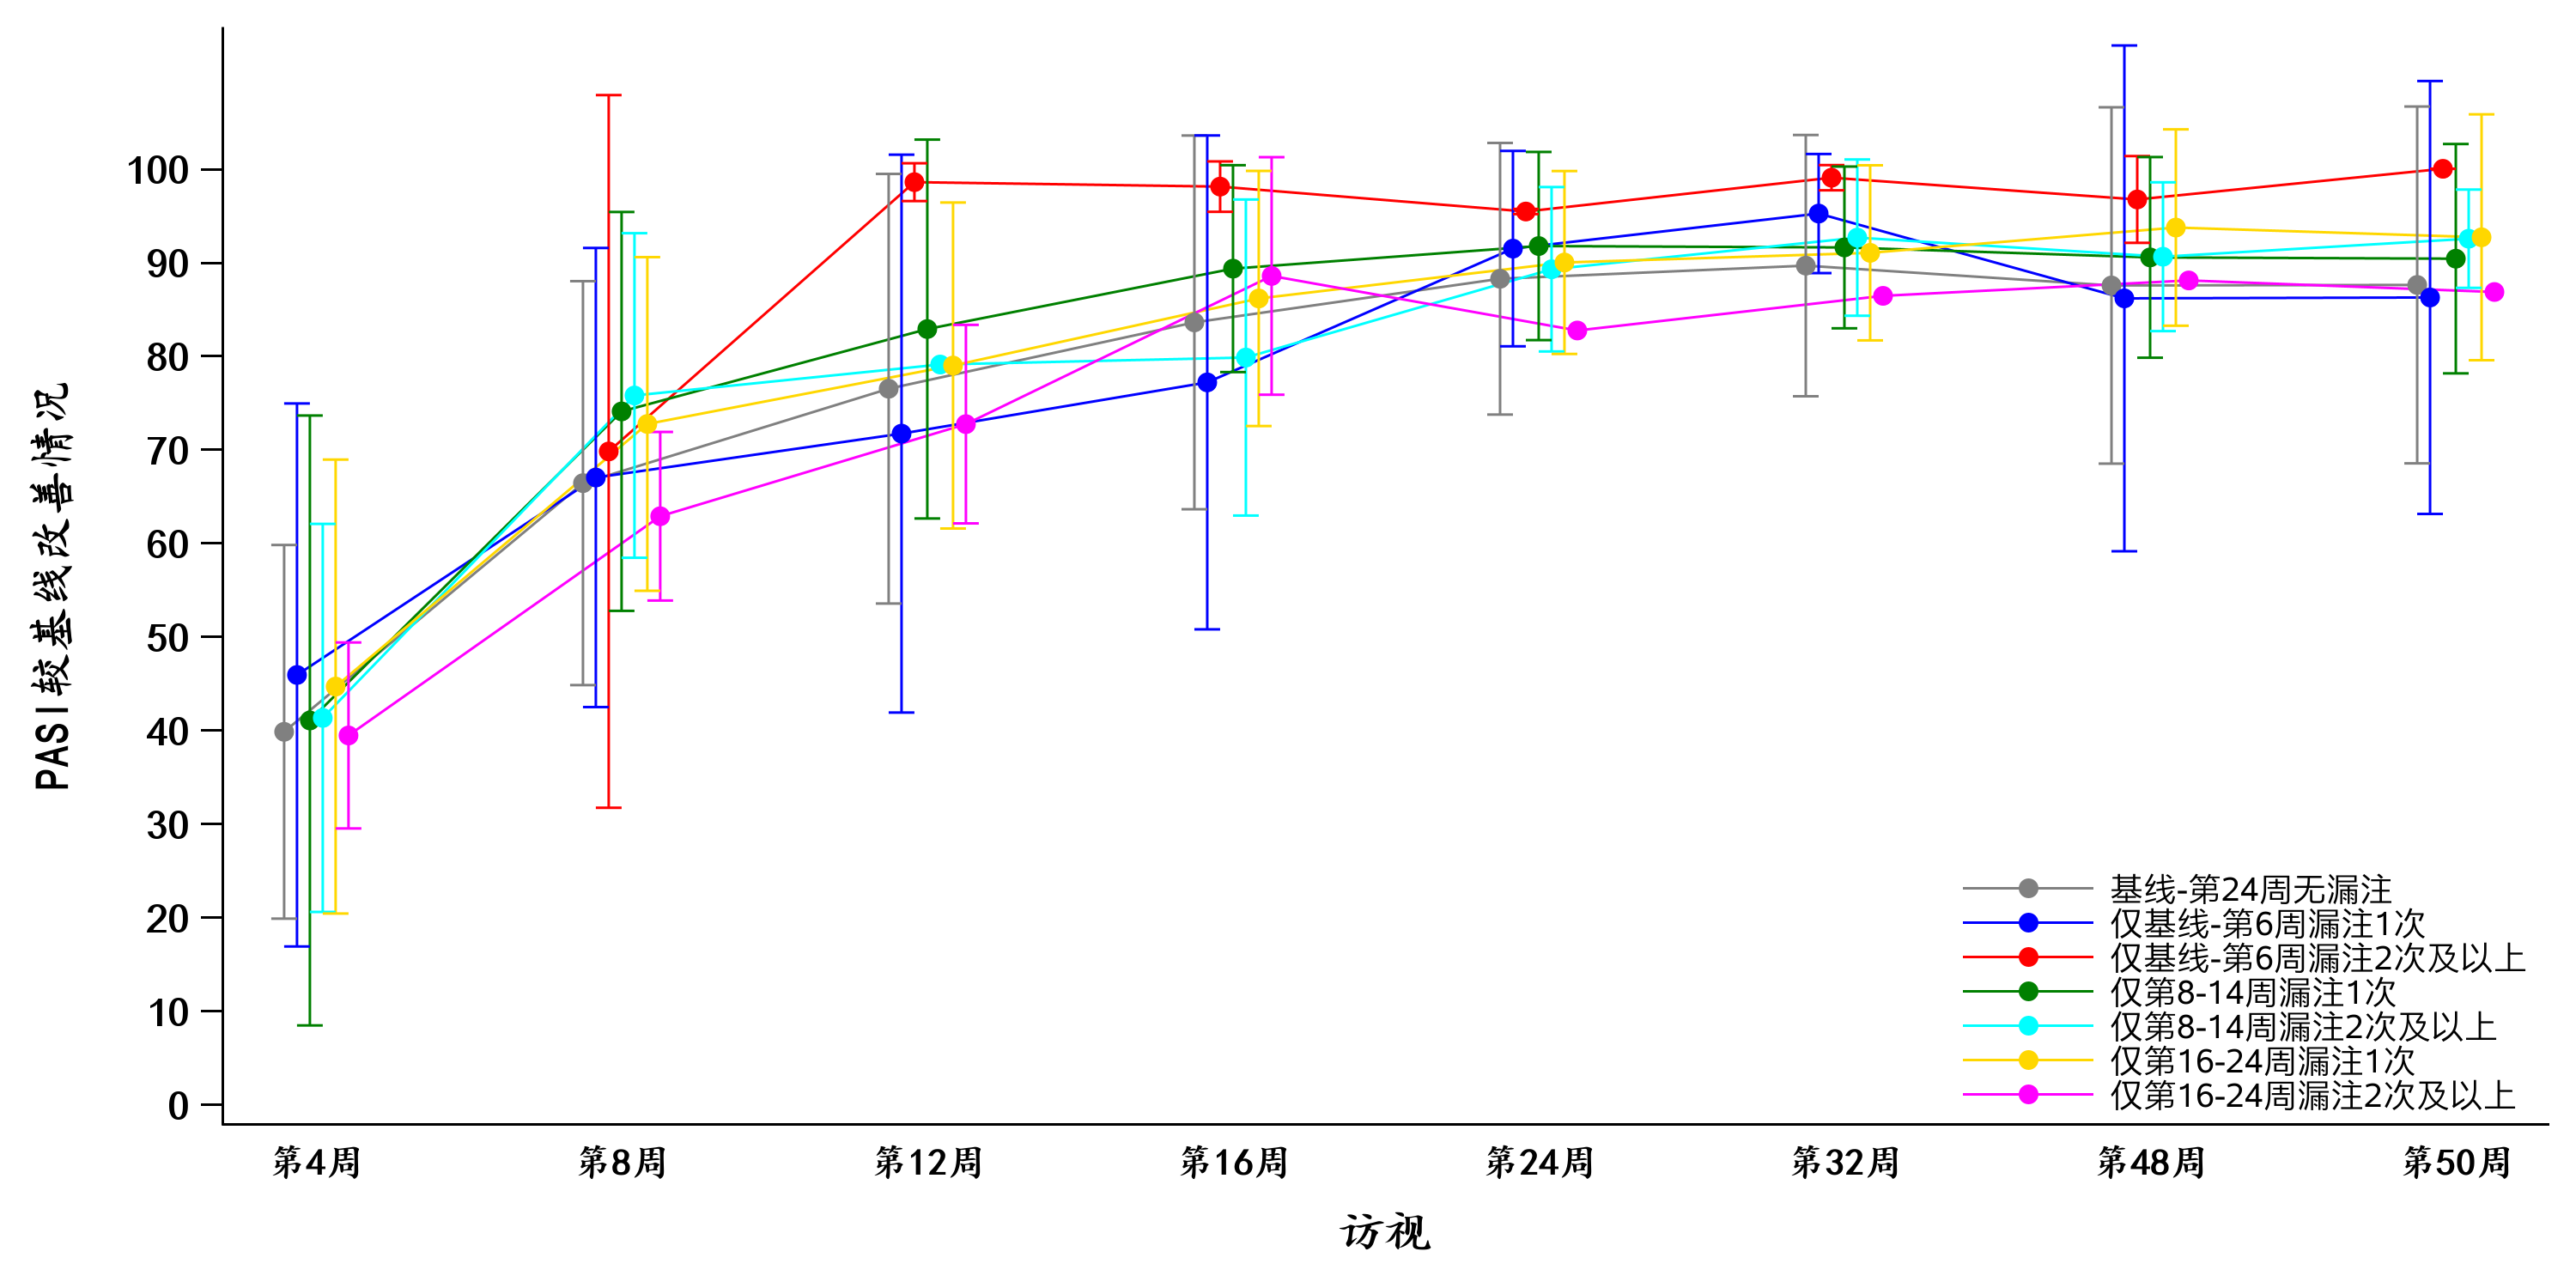
proc template;
define statgraph sgdesign;
begingraph;
layout overlay / walldisplay=(FILL)
xaxisopts=( label=('访视') labelattrs=(size=12 family = "楷体" weight=bold)
discreteopts=(tickvaluefitpolicy=splitrotate) offsetmin=0.04 offsetmax=0.04
tickvalueattrs=(size=10pt weight=bold family='楷体')
display=(label LINE TICKVALUES ))
yaxisopts=( label=('PASI较基线改善情况') labelattrs=(size=12 family = "楷体" weight=bold)
linearopts=(viewmin=0 tickvaluesequence=( start=0 end=100 increment=10))
tickvalueattrs=(size=10pt weight=bold family='Arial Unicode MS')
display=(label LINE ticks tickvalues));
seriesplot x=avisit y=mean / group=anagrpn name='series' yerrorlower=lmean yerrorupper=umean groupdisplay=cluster clusterwidth=0.3 connectorder=xaxis display=(markers) lineattrs=(pattern=SOLID );
discretelegend 'series' / opaque=false border=false halign=right valign=bottom displayclipped=true across=1 order=rowmajor location=inside;
endlayout;
endgraph;
end;
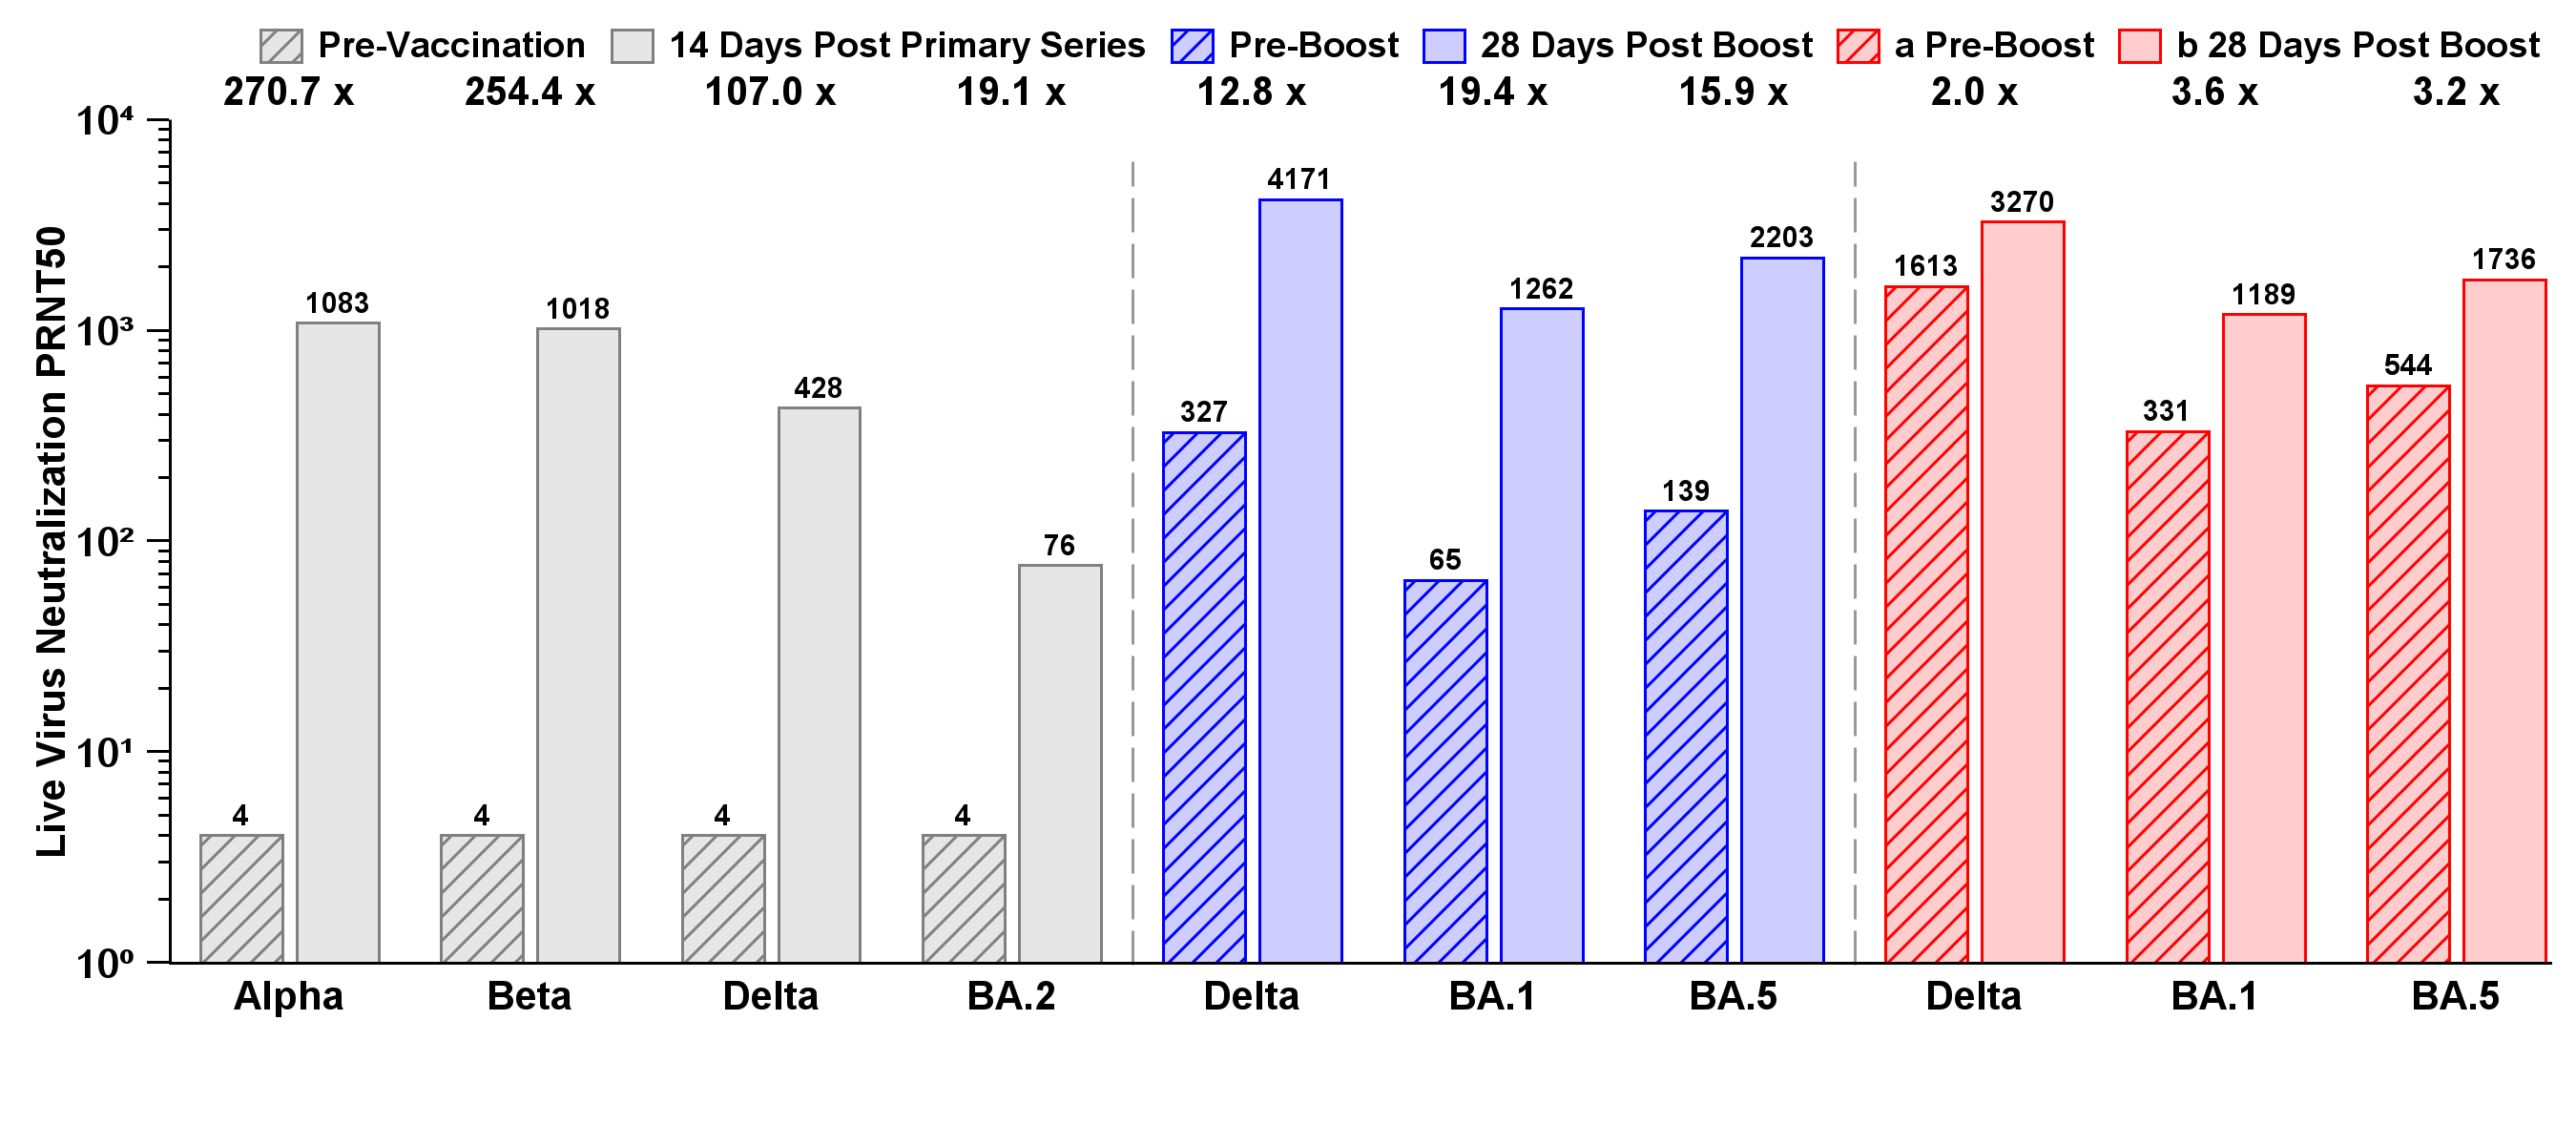
run;GTL绘制柱状图
barchart plot绘制柱状图,groupdisplay=Stack设置为堆积图
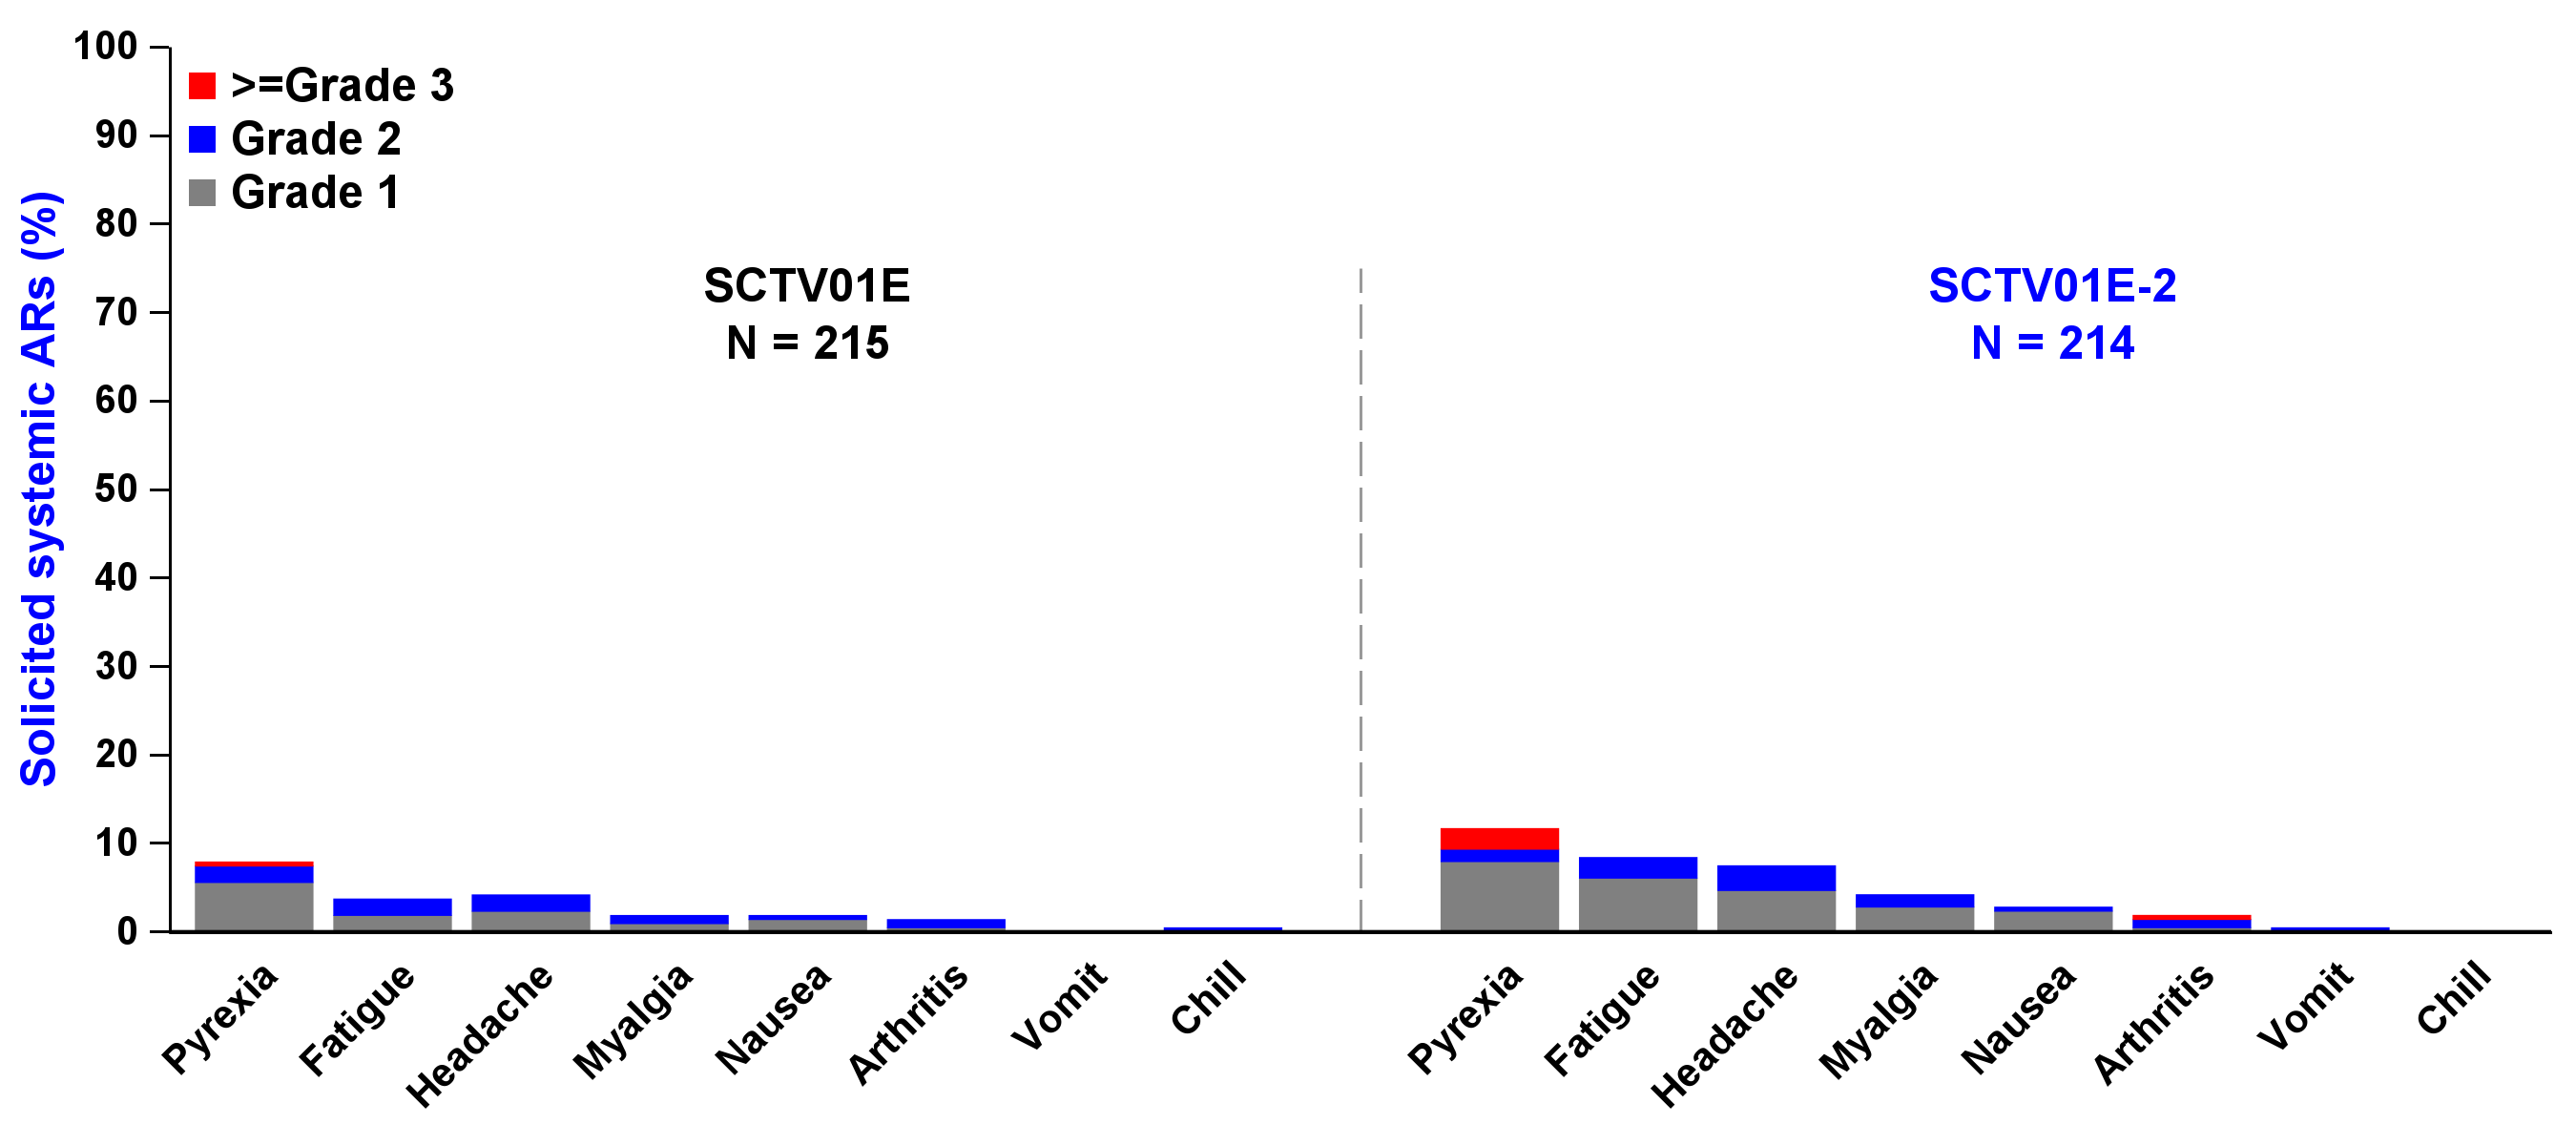
proc template;
define statgraph sgdesign;
begingraph/ pad=(left=30);;

   discreteattrmap name="barcolor";
      value "1"/ fillattrs=(color=gray )  ;
      value "2"/ fillattrs=(color=blue )  ;
      value "3"/ fillattrs=(color=red  )  ;
   enddiscreteattrmap;
   discreteattrvar attrvar=bargroup var=atoxgrn attrmap="barcolor";

  legenditem type=fill name="fill1" / fillattrs=(color=gray) filldisplay=(fill) label="Grade 1";
  legenditem type=fill name="fill2" / fillattrs=(color=blue) filldisplay=(fill) label="Grade 2";
  legenditem type=fill name="fill3" / fillattrs=(color=red) filldisplay=(fill)  label=">=Grade 3";

      layout overlay / walldisplay=(FILL)
                xaxisopts=( discreteopts=( tickvaluefitpolicy=ROTATE tickvaluerotation=diagonal2 tickvalueformat=$xfmt. /*tickvaluefitpolicy=rotatealways tickvaluerotation= vertical*/)
                      tickvalueattrs=(size=10pt weight=bold) display=( LINE TICKVALUES ))
                yaxisopts=(offsetmax=0 offsetmin=0 display=( LINE ticks tickvalues) labelattrs=(size=14 weight=bold) labelfitpolicy=SPLITALWAYS labelsplitchar="@"
                    tickvalueattrs=(color=black size=10pt weight=bold family='Arial')
                    linearopts=( viewmin=0.0 viewmax=100.0 tickvaluesequence=(start=0 end=100 increment=10.0) )
                    );

         barchart category=order response=pct / group=bargroup name='bar' display=(fill) stat=mean barwidth=0.85 groupdisplay=Stack clusterwidth=1.0 grouporder=data ;

         discretelegend  'fill3' 'fill2' 'fill1'/ opaque=true border=false halign=left valign=top displayclipped=true across=1 order=rowmajor location=inside valueattrs=(size=12pt);

         annotate;
      endlayout;
endgraph;
end;
run;
GTL绘制森林图
forest plot绘制森林图,其他的所有label通过annotation实现。
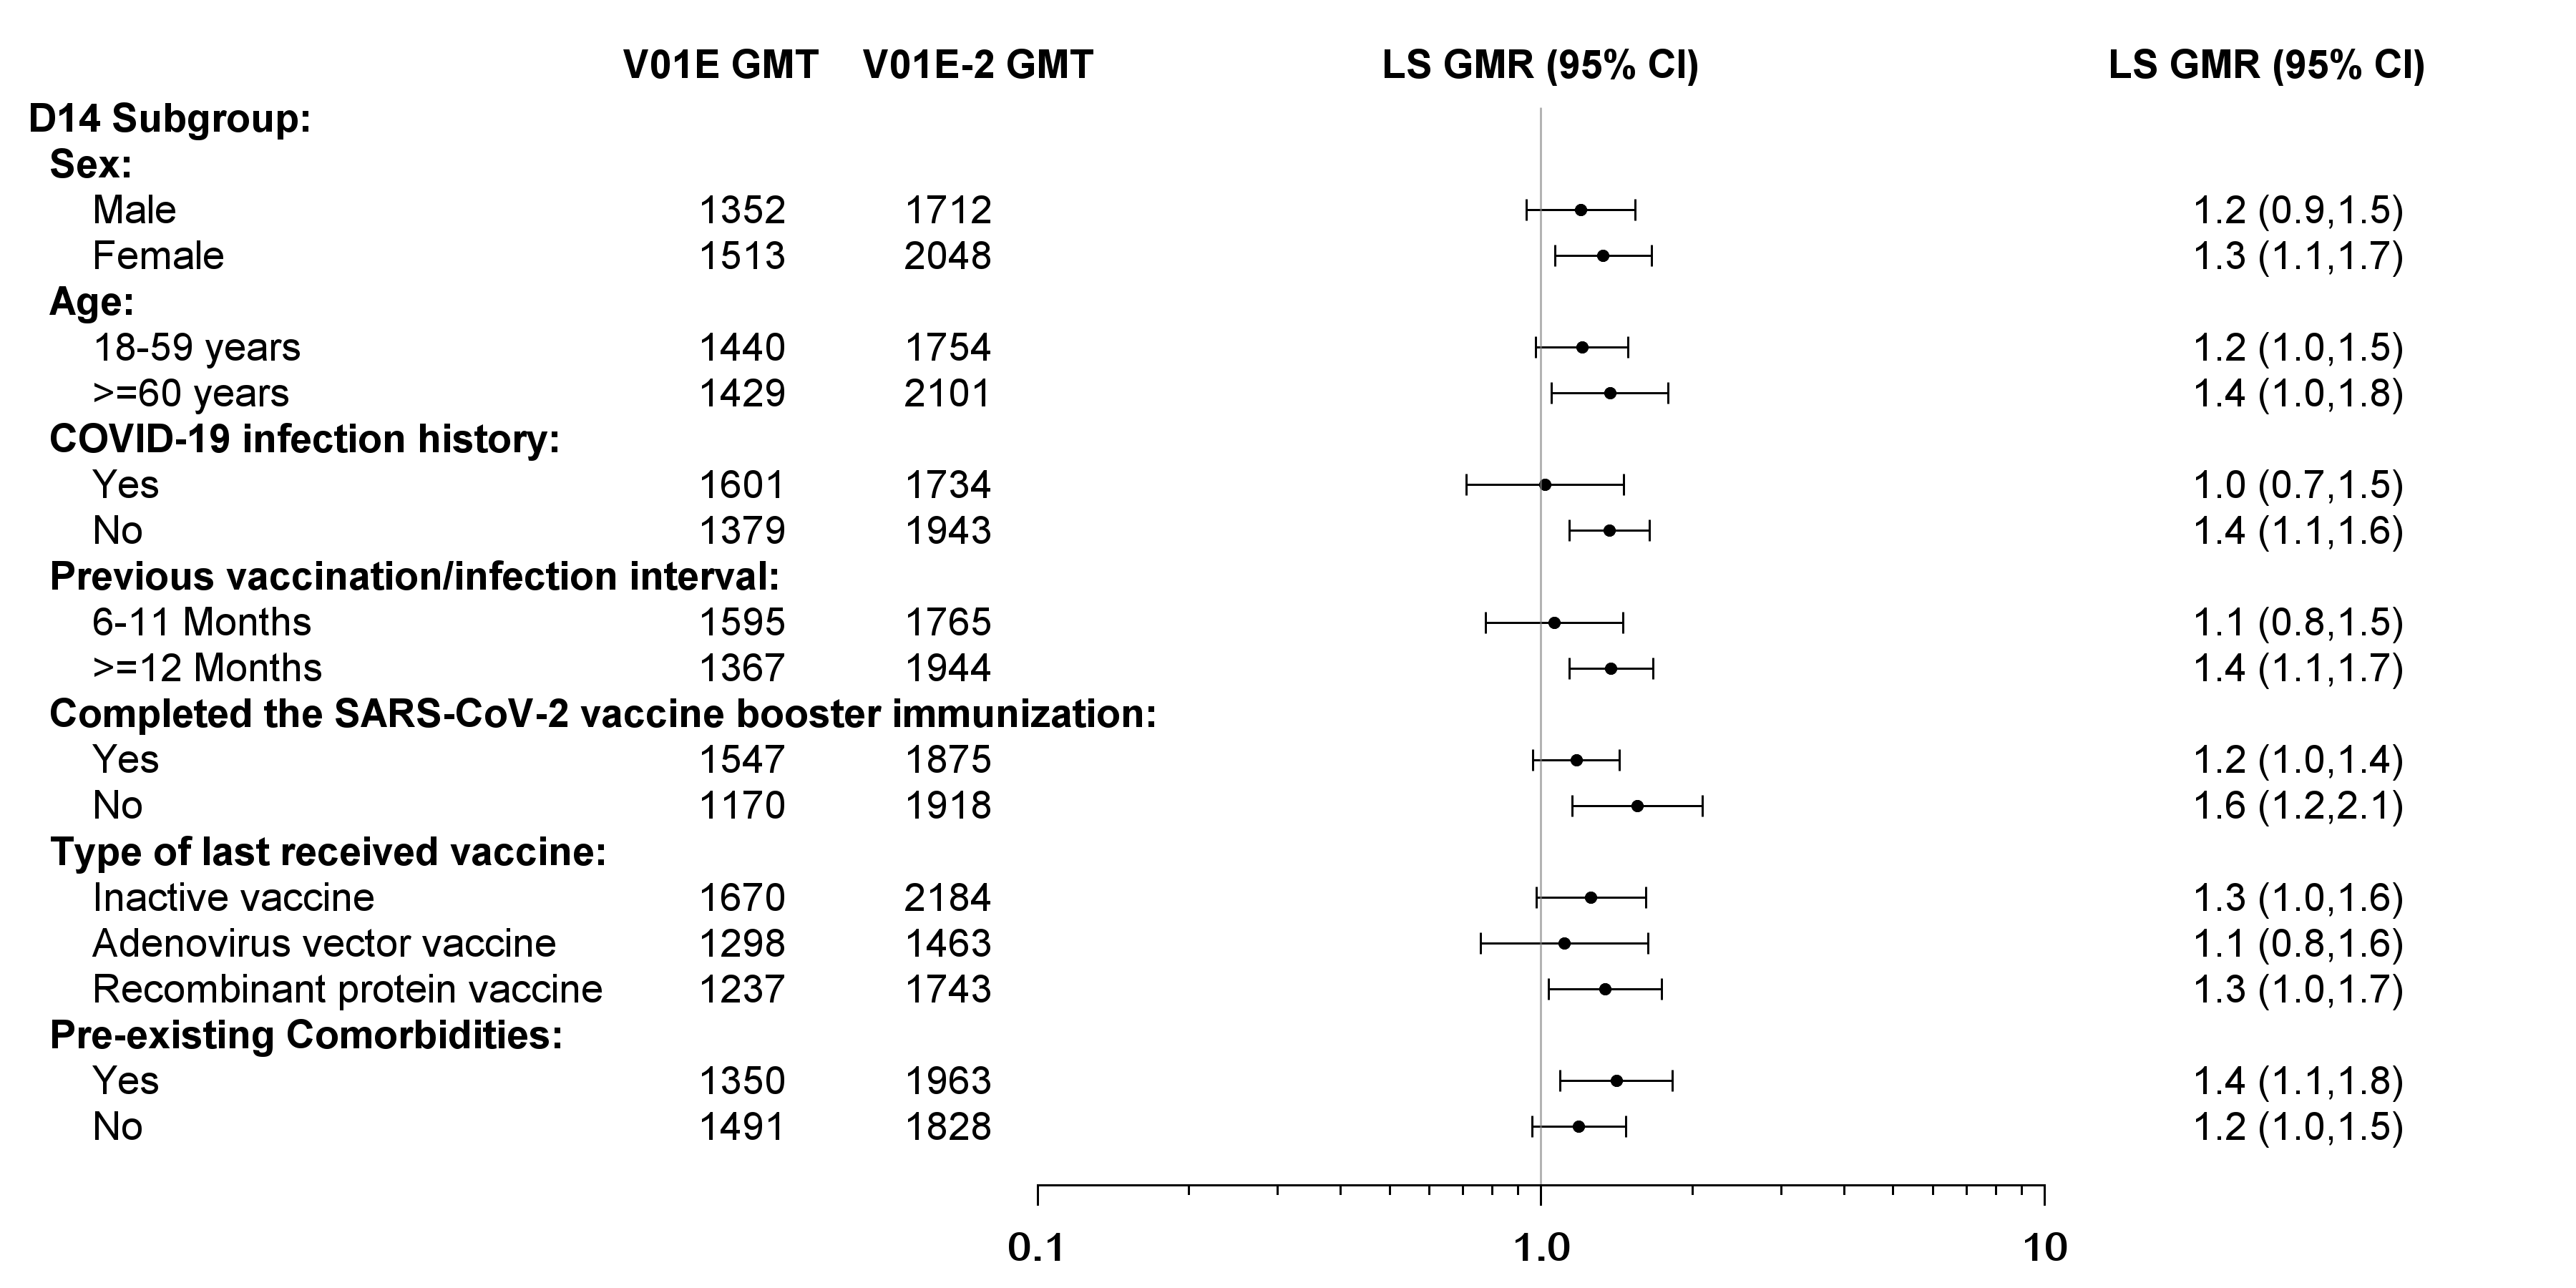
proc template;
define statgraph sgdesign;
begingraph / pad=(top=40 bottom=5);

      layout overlay / walldisplay=(FILL)
            yaxisopts=(display=NONE  reverse=true offsetmax=0.01 offsetmin=0.01 linearopts=( viewmin=0
                      viewmax=23
            ))

            xaxisopts=(offsetmin=0.4 offsetmax=0.2 display=(TICKS TICKVALUES)  type=log logopts=( viewmin=0.1 viewmax= 10
                base=10 tickintervalstyle=logexpand minorticks=true tickvalueformat=xfmt.) tickvalueattrs=(size=12pt weight=bold family='Arial Unicode MS'));

         scatterplot x=means y=yord / xerrorupper=yerru xerrorlower=yerrl markerattrs=(size=5 symbol=circlefilled color=black) errorbarattrs=(color=black thickness=1);
         referenceline x=1 /datatransparency=0.4;

        annotate;
      endlayout;

endgraph;
end;
run;
如果想要间隔一行加一条浅色的背景色块,可以通过referenceline y=ref /datatransparency=0.8 lineattrs=(thickness=20 color=grey);实现。
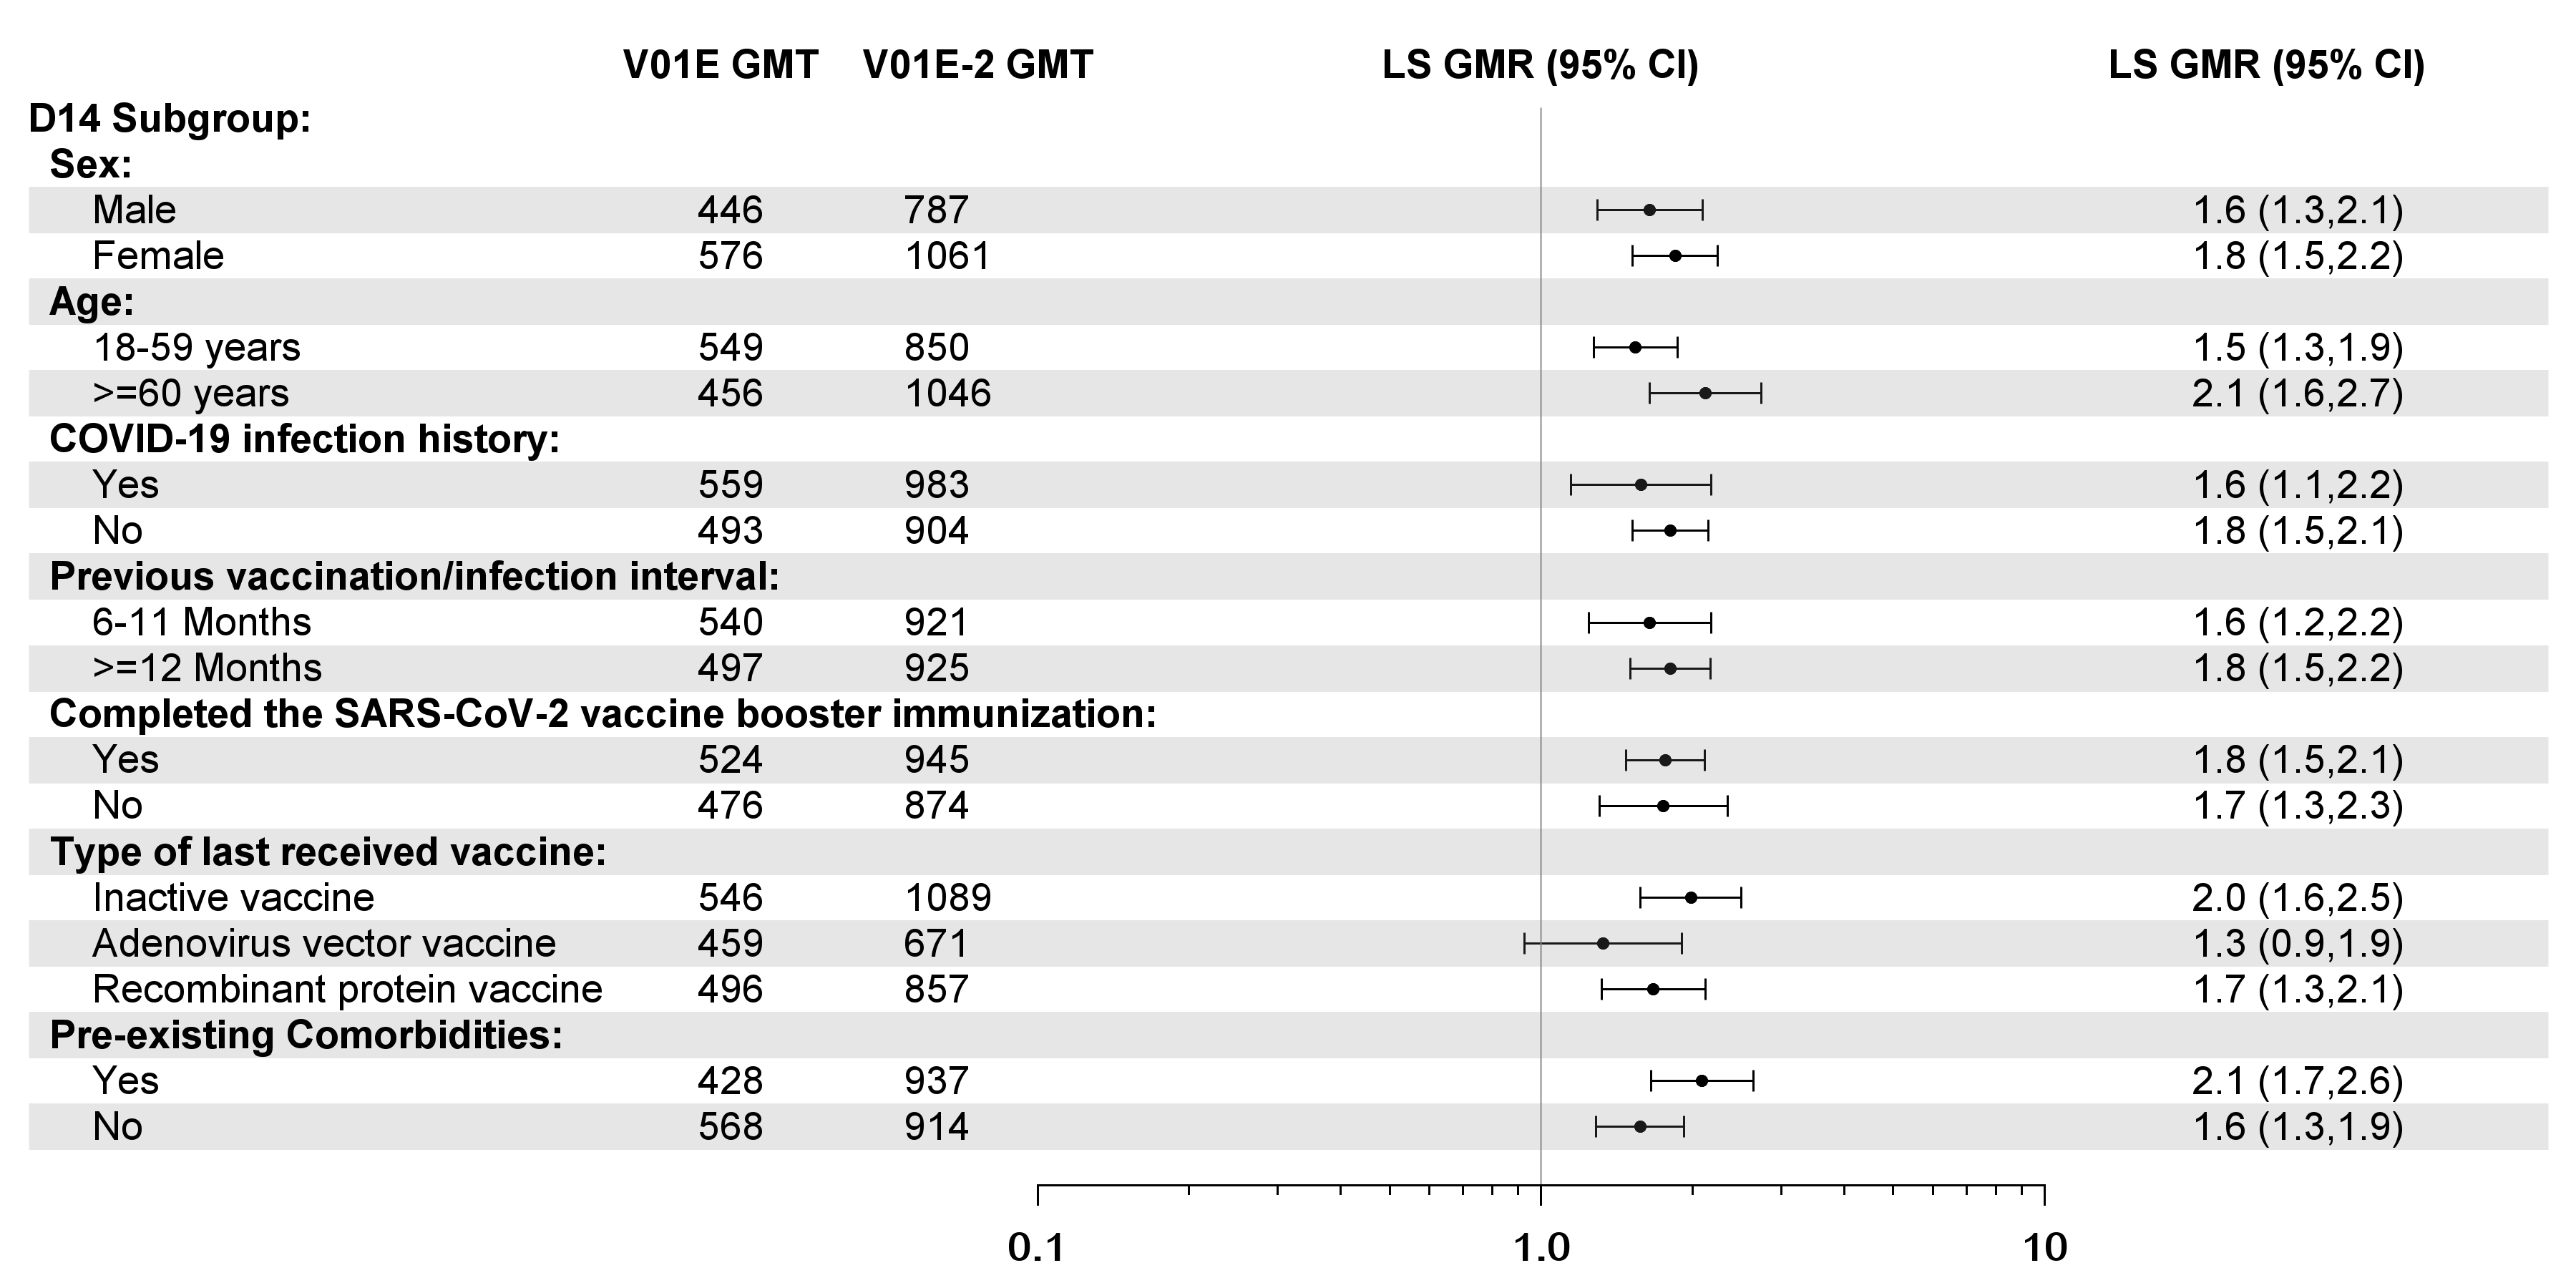
proc template;
define statgraph sgdesign;
begingraph / pad=(top=40 bottom=5);

      layout overlay / walldisplay=(FILL)
            yaxisopts=(display=NONE  reverse=true offsetmax=0.01 offsetmin=0.01 linearopts=( viewmin=0
                      viewmax=23
            ))

            xaxisopts=(offsetmin=0.4 offsetmax=0.2 display=(TICKS TICKVALUES)  type=log logopts=( viewmin=0.1 viewmax= 10
                base=10 tickintervalstyle=logexpand minorticks=true tickvalueformat=xfmt.) tickvalueattrs=(size=12pt weight=bold family='Arial Unicode MS'));

         scatterplot x=means y=yord / xerrorupper=yerru xerrorlower=yerrl markerattrs=(size=5 symbol=circlefilled color=black) errorbarattrs=(color=black thickness=1);
         referenceline x=1 /datatransparency=0.4;
         referenceline y=ref /datatransparency=0.8 lineattrs=(thickness=20 color=grey);

        annotate;
      endlayout;

endgraph;
end;
run;